Okay this is kind of strange but I did a couple things...I'm unsure how to feel/understand what's happening.
First, jwhat here is my current printenv in POD:
Code:
A 000 001c01: POD SysCt Cac> printenv

A 000 001c01: LastModule      1

A 000 001c01: Premium         0

A 000 001c01: SCACHEWARCnt    0

A 000 001c01: PartitionID     0

A 000 001c01: NASID           0

A 000 001c01: CpuMask         2000

A 000 001c01: MemMask         22220000

A 000 001c01: MemorySize      44440000
First thing I did was update the L1, thanks a huge bunch to jwhat for the l1.bin files and flashers...here is what I ended up doing inside an Irix terminal:
I am running like 1.28?, so the really the first file from his list was 1.40, so I flashed that into slot A, since I was running on slot b. Now if you look up the instructions for flashsc you DO NOT HAVE TO REBOOT YOUR COMPUTER, you have to restart the L1 in the programmed slot.
You do this by:
l1cmd flash default a
l1cmd reboot_l1
l1cmd version
The response should be your newly flashed version, then I flashed slot b to the 1.48 (SGI Patch) version, then did the same thing: Default to slot B, reboot_l1, show version...all worked great! Again thanks a ton jwhat!
So after that I was feeling pretty good and installed all the diags software (including the diags from SGI depot) for Fuel.
This is where trouble began, I left it alone on "runalldiags -extensive" and found it had rebooted itself! Not good. At this point I ONLY KNEW I had passed PIMM and CACHE testing because that's when I left the room.
Code:
A Fatal: Serial #: 0800691070F8

A 000 001c01: A Fatal: HARDWARE ERROR STATE:

A 000 001c01: A Fatal: +  Errors on node Nasid 0x0 (0)

A 000 001c01: A Fatal: +    IP35 in /hw/module/001c01/node [serial number NEE073]

A 000 001c01: A Fatal: +      BEDROCK signalled following errors.

A 000 001c01: A Fatal: +        BEDROCK PI 0 Error spool A:

A 000 001c01: A Fatal: +            *** 54 Access Errors to unpopulated memory skipped

A 000 001c01: A Fatal: +    IO Board in /hw/module/001c01/io widget: 0xe serial:

A 000 001c01: A Fatal: +      Bridge ASIC errors:

A 000 001c01: A Fatal: +        Bridge interrupt status register: 0x1000000

A 000 001c01: A Fatal: +          INT_N status: 0x0

A 000 001c01: A Fatal: +          24: Request packet has invalid address for bridge widget

A 000 001c01: A Fatal: +        Bridge error command word register 0xffffffffea038000

A 000 001c01: A Fatal: +        Bridge Error Upper Address Register: 0x0

A 000 001c01: A Fatal: +        Bridge Error Lower Address Register: 0x110

A 000 001c01: A Fatal: End Hardware Error State

A 000 001c01: A Fatal: ++FRU ANALYSIS BEGIN

A 000 001c01: A Fatal: No rules triggered:  Insufficient data

A 000 001c01: A Fatal:

A 000 001c01: Timeout Histogram is empty.

A 000 001c01:

A 000 001c01: A Fatal: ++FRU ANALYSIS END

A 000 001c01: A Fatal: PANIC: PCI Bridge Error interrupt killed the system

A 000 001c01: --More--

A 000 001c01:

A 000 001c01: A Fatal:

A 000 001c01: Dumping to /hw/module/001c01/Ibrick/xtalk/15/pci/1/scsi_ctlr/0/target/1/lun/0/disk/partition/1/block at block 0, space: 0x2000 pages

A 000 001c01: A Info : System dump startedA Fatal: Dumping low memory...A Fatal:

A 000 001c01: A Fatal: Dumping static kernel pages...A Fatal:

A 000 001c01: A Fatal: Dumping pfdat pages...A Fatal:

A 000 001c01: A Fatal: Dumping backtrace pages...A Fatal:

A 000 001c01: A Fatal: Dumping dynamic kernel pages...A Fatal:

A 000 001c01: A Fatal: Dumping buffer pages...A Fatal:

A 000 001c01: A Fatal: Dumping remaining in-use pages...A Fatal:

A 000 001c01: Available dump space depleted.

A 000 001c01: A Fatal:

A 000 001c01: A Fatal:

A 000 001c01: A Fatal: Restarting the machine...
I do not think I had any L1/Console serial active during this time..as I had buttoned the case up and expected things to go smoothly...
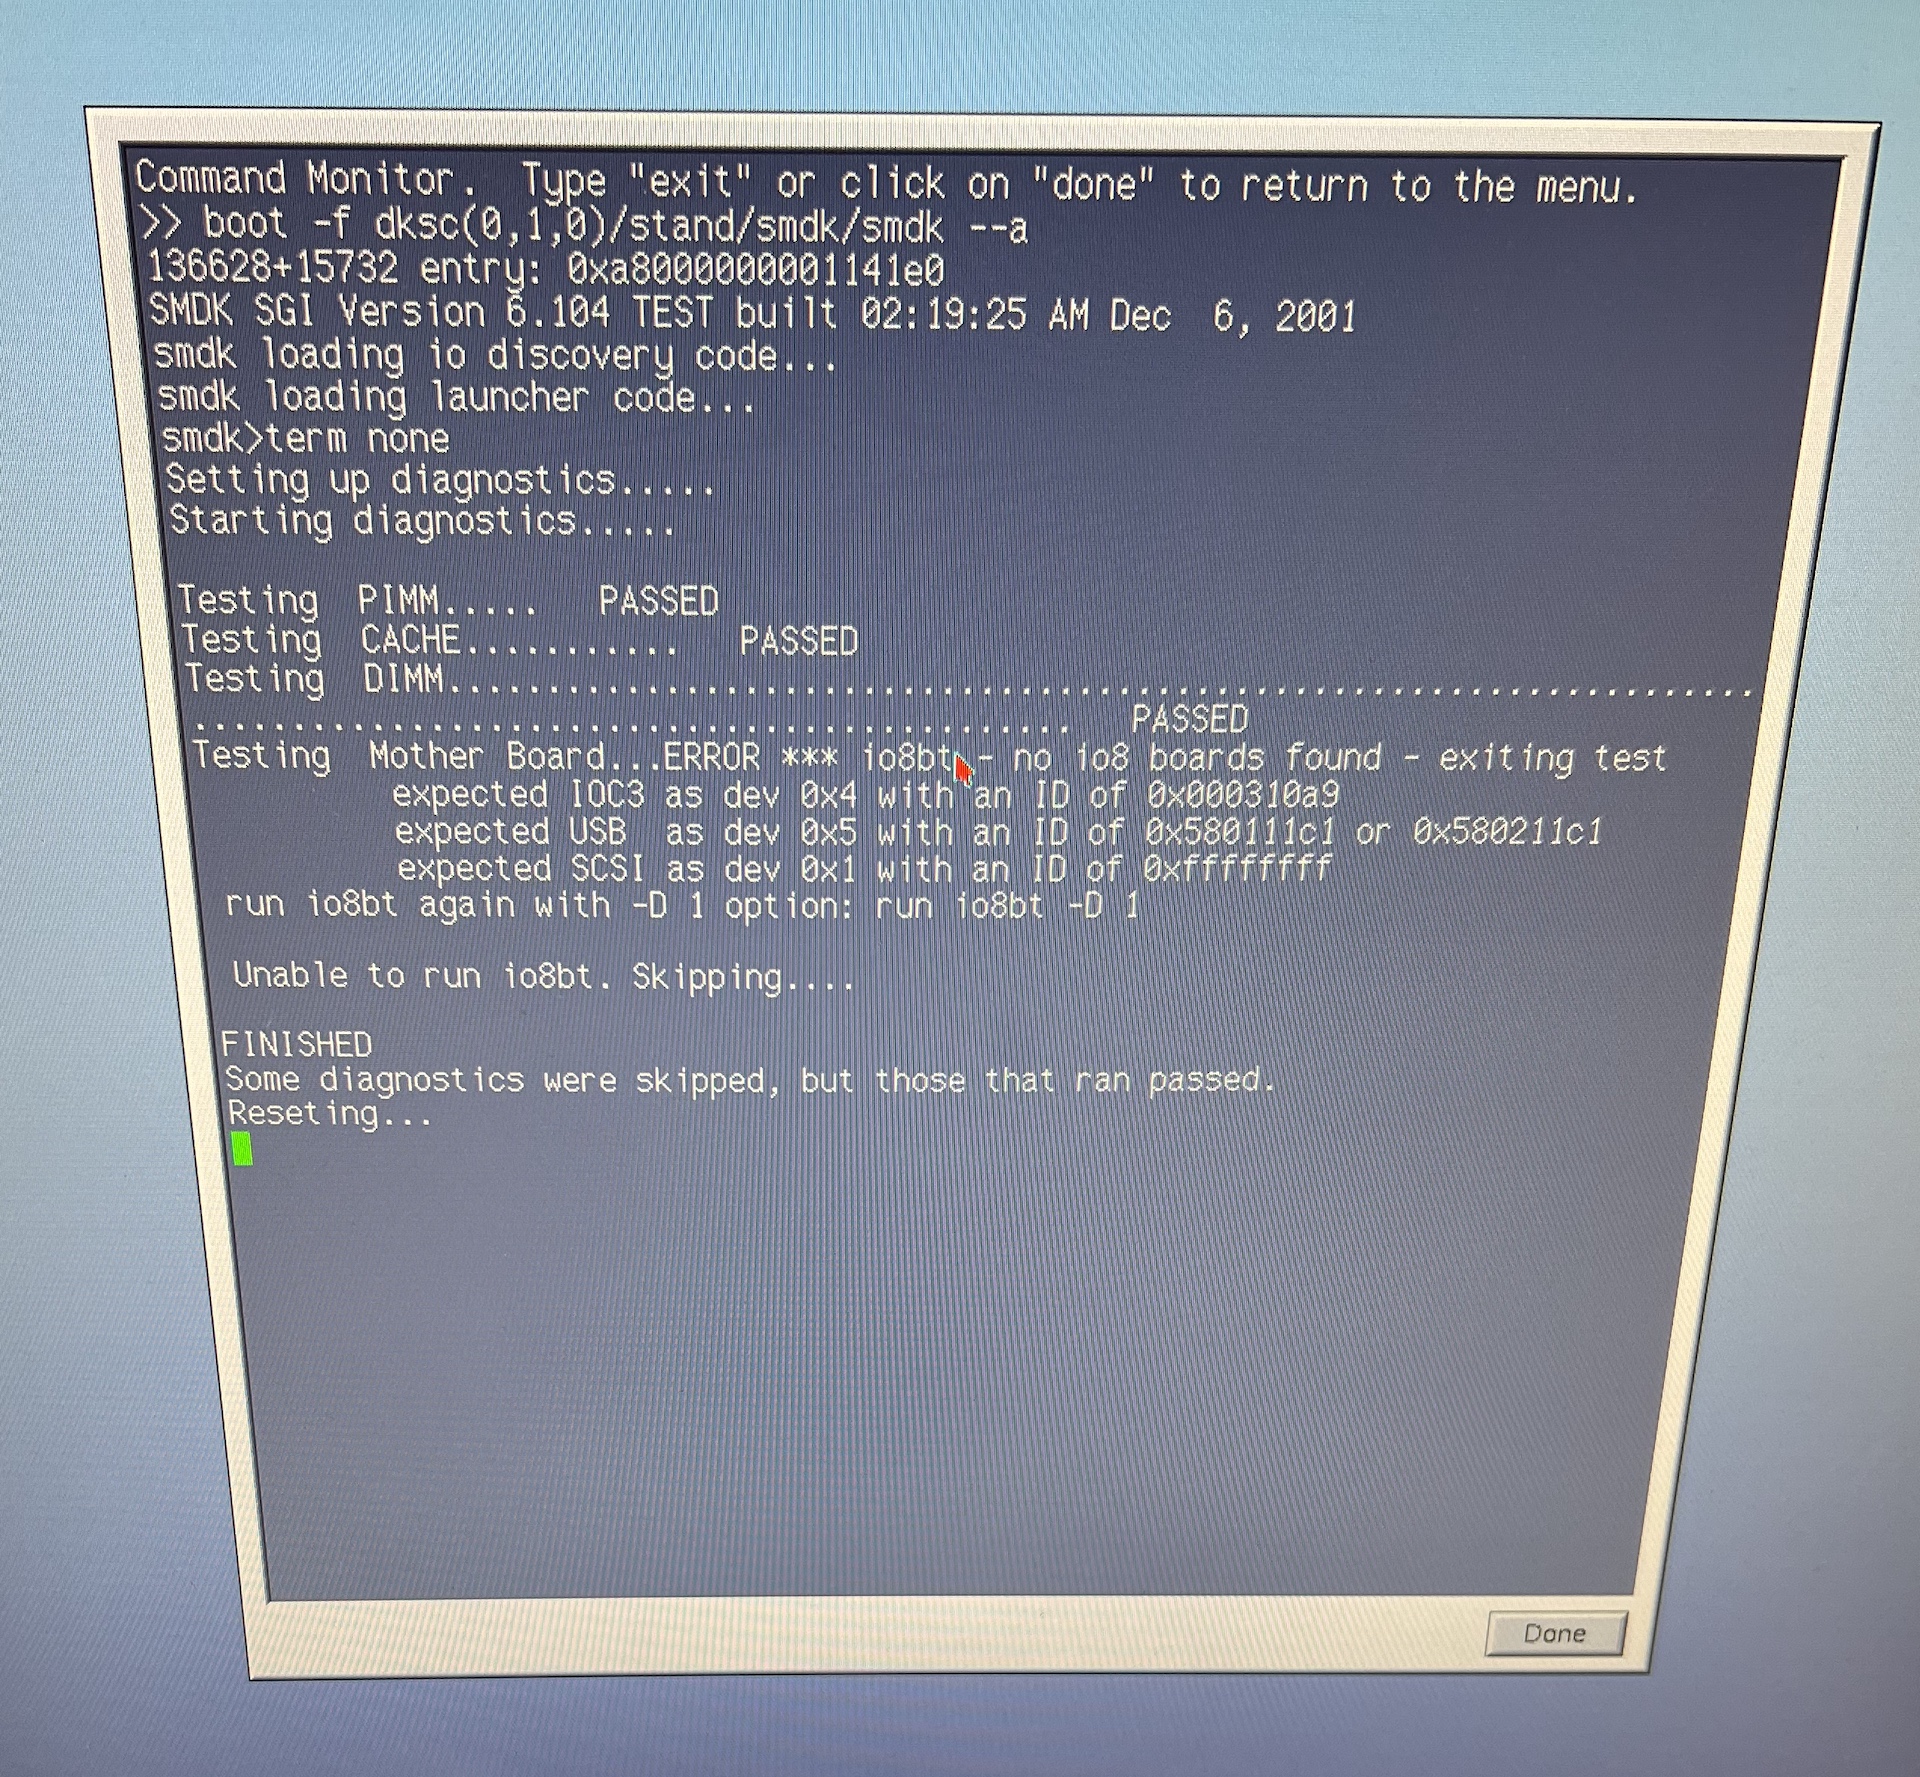
Okay I started the OFFLINE SMDK, this was also very confusing...it errored when it got to the mainboard

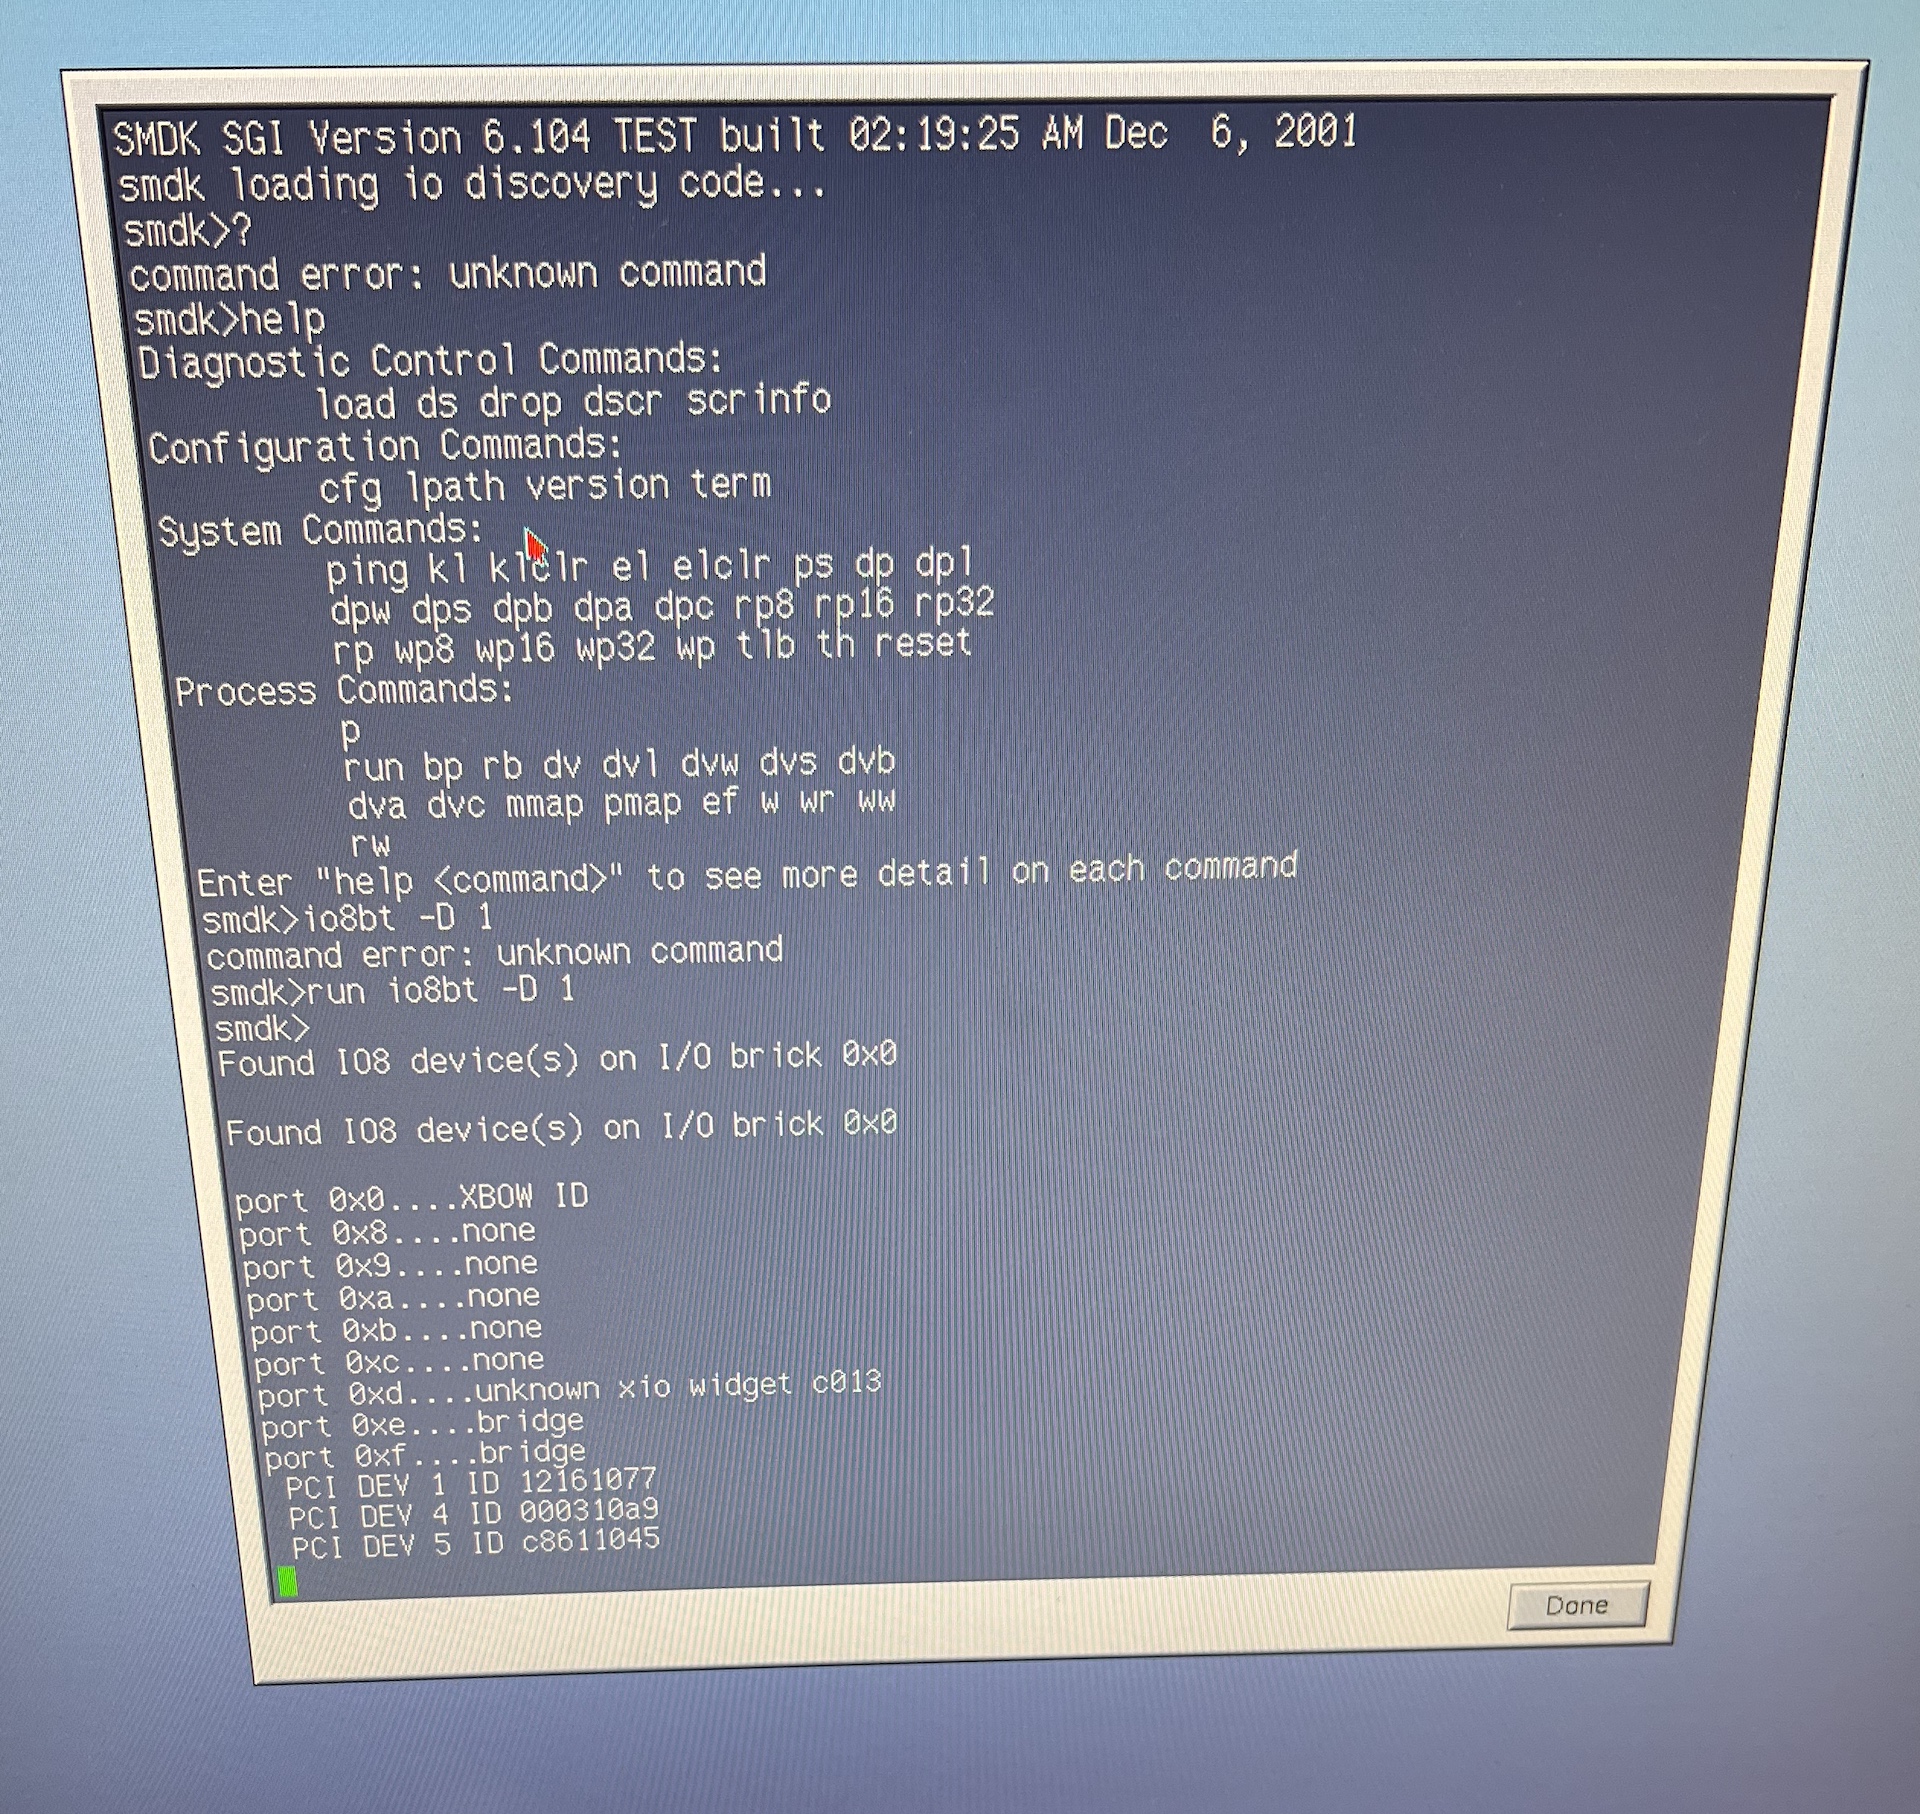
I ran the test it told me to and all I got was output (not a pass or fail) there is zero documentation on SMDK and it's cryptic enough that I couldn't figure anything much out.

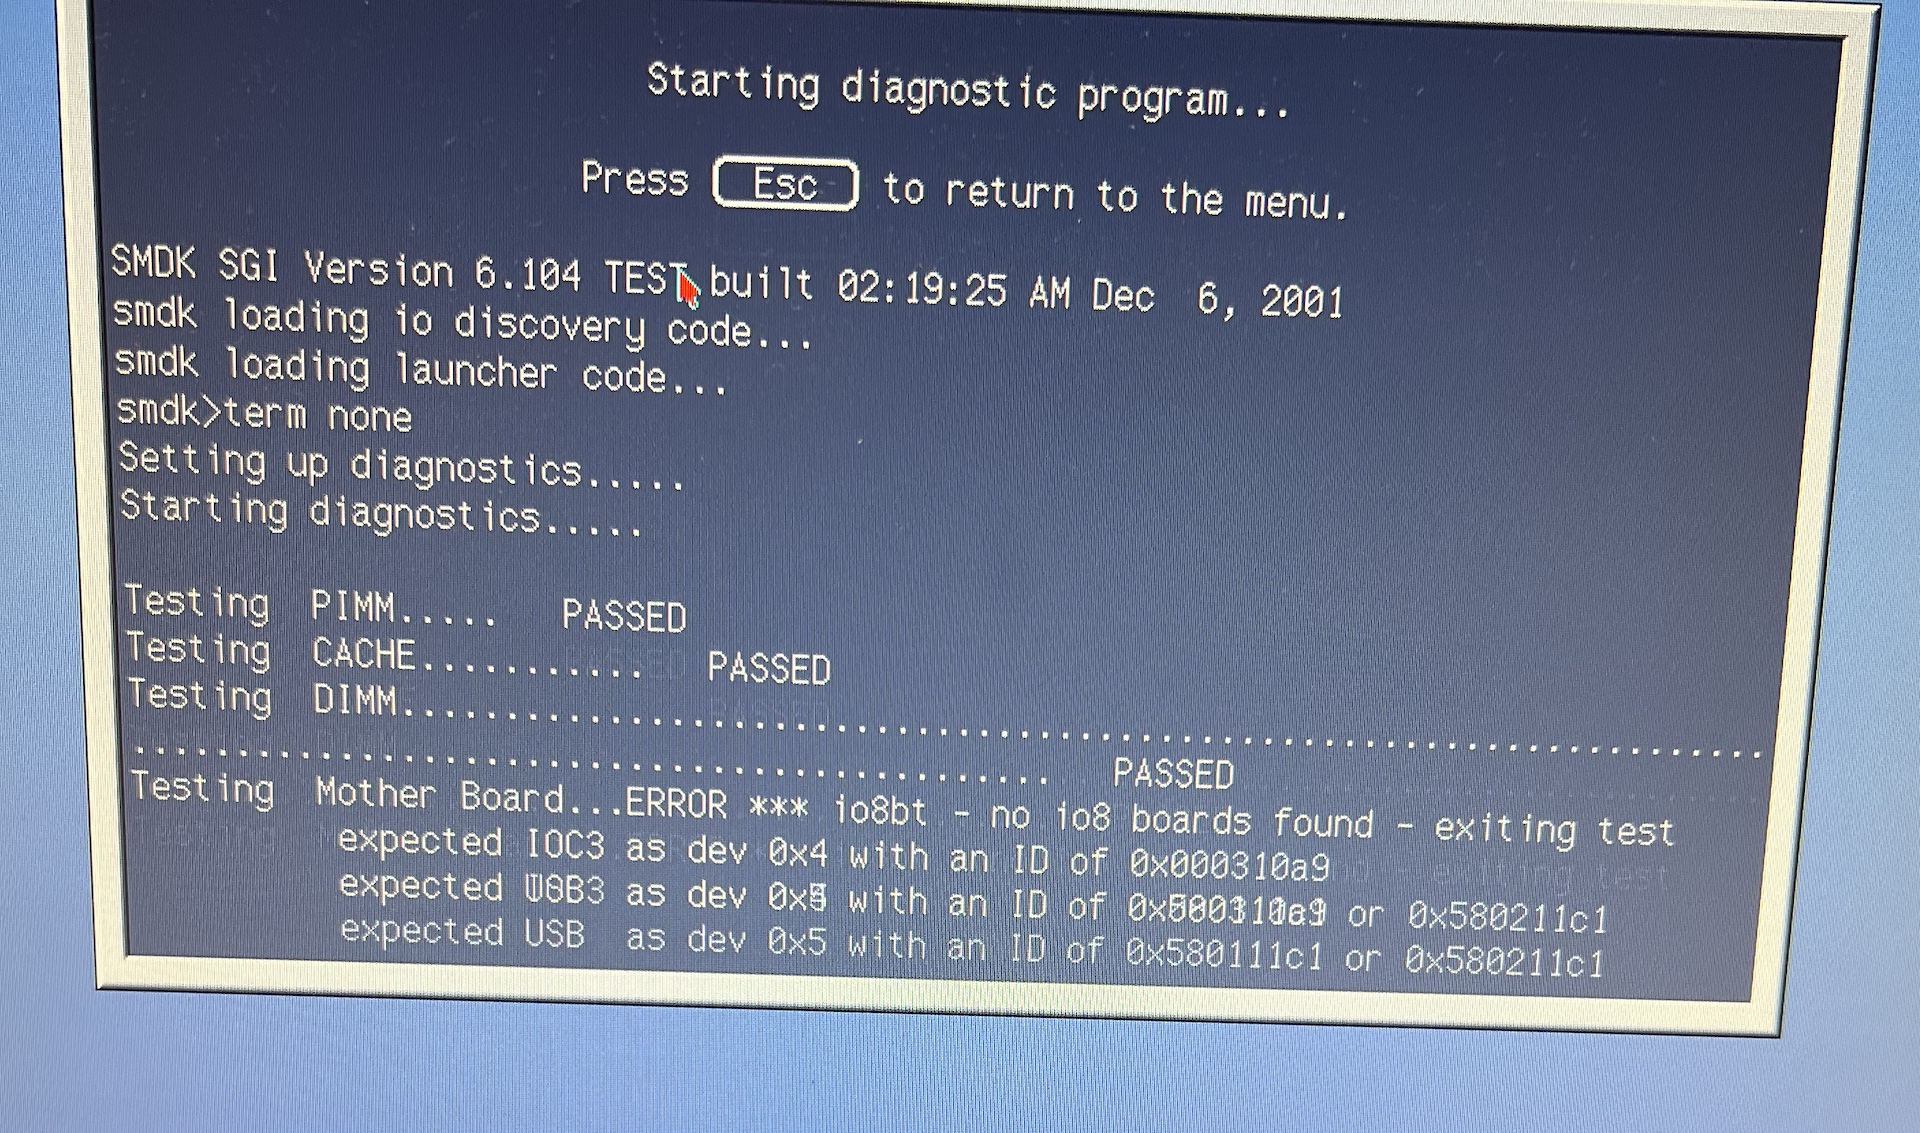
Even using the "run diagnostics" button on PROM did the same thing:

Now I have the LAST MAINBOARD REVISION which is dated 2004, the test routine is dated before that...so could they have made a version that breaks older diags??!?! Jwhat, what is your Fuel mainboard revision, the one you ran "runalldaigs" on?
I decided to force the PROM into FACTORY TESTING startup using: debug 3
This is what I got:
Code:
001a01-L1>debug 3
debug switches set to 0x0003
returning to console mode 001a01 console, <CTRL_T> to escape to L1
A 000 001c01: Starting PROM Boot process
A 000 001c01: Manufacturing mode output initialized.
A 000 001c01: Running xbow_sanity diag (Xbow address = 0x9200000000000000)
A 000 001c01: RSLT xbow_sanity PASS
A 000 001c01: Running bridge_sanity diag (Bridge base = 0x920000000e000000)
A 000 001c01: RSLT bridge_sanity PASS
A 000 001c01: Running bridge_sanity diag (Bridge base = 0x920000000f000000)
A 000 001c01: RSLT bridge_sanity PASS
A 000 001c01: Running io_config_space diag (Bridge base = 0x920000000f000000)
A 000 001c01: io_config_space: Device 1 Type Qlogic 12160
A 000 001c01: PCI Id 12161077
A 000 001c01: PCI Revision = 6
A 000 001c01: io_config_space: Device 4 Type IOC3
A 000 001c01: PCI Id 310a9
A 000 001c01: PCI Revision = 1
A 000 001c01: io_config_space: Device 5 Type Opti 82C861
A 000 001c01: PCI Id ffffffffc8611045
A 000 001c01: PCI Revision = 31010
A 000 001c01: RSLT io_config_spac PASS
A 000 001c01: glc: pciid 0x12161077 in slot 1
A 000 001c01: glc: pciid 0x310a9 in slot 4
A 000 001c01: Running pcibus_sanity diag (Bridge base = 0x920000000f000000 PCI dev = 4)
A 000 001c01: RSLT pcibus_sanity PASS
A 000 001c01: Running serial_pio diag (Bridge base = 0x920000000f000000 PCI dev = 4)
A 000 001c01: RSLT serial_pio PASS
A 000 001c01: glc: c->uart_base == 0x920000000f820178
A 000 001c01: IOC3_SIO_CR address == 0x920000000f800028
A 000 001c01: IOC3_SIO_CR == 0x67ae5e
A 000 001c01: About to read 920000000f820178
A 000 001c01:
A 000 001c01:
A 000 001c01: IP35 PROM SGI Version 6.210 built 02:33:51 PM Aug 26, 2004
A 000 001c01: Running in DDR mode
A 000 001c01: *** Warning: System controller debug switches are non-zero (0x3)
A 000 001c01: *** Diag level set to Manufacturing (3)
A 000 001c01: RSLT hub_intrpt_dia PASS
A 000 001c01: Testing/Initializing memory .......
A 000 001c01: node 0 bank 0
A 000 001c01:
A 000 001c01: Memory tests PASSED for DimmPair: 0
A 000 001c01: DIMMs: 0 & 1
A 000 001c01: Bank: 0
A 000 001c01:
A 000 001c01: node 0 bank 1
A 000 001c01:
A 000 001c01: Memory tests PASSED for DimmPair: 0
A 000 001c01: DIMMs: 0 & 1
A 000 001c01: Bank: 1
A 000 001c01:
A 000 001c01: node 0 bank 2
A 000 001c01:
A 000 001c01: Memory tests PASSED for DimmPair: 1
A 000 001c01: DIMMs: 2 & 3
A 000 001c01: Bank: 0
A 000 001c01:
A 000 001c01: node 0 bank 3
A 000 001c01:
A 000 001c01: Memory tests PASSED for DimmPair: 1
A 000 001c01: DIMMs: 2 & 3
A 000 001c01: Bank: 1
A 000 001c01:
A 000 001c01: node 0 bank 4
A 000 001c01: node 0 bank 5
A 000 001c01: node 0 bank 6
A 000 001c01: node 0 bank 7
A 000 001c01: DONE
A 000 001c01: Copying PROM code to memory ............... DONE
A 000 001c01: RSLT scache_test PASS
A 000 001c01: Discovering local IO ......................
A 000 001c01: Found Xbridge at 0x920000000e000000
A 000 001c01: ;Laser:000000005455827f;
A 000 001c01: Found Xbridge at 0x920000000f000000
A 000 001c01: ;Laser:000000005455827f;
A 000 001c01:
A 000 001c01: Ibrick Widget f PCI slot 1 pciid 12161077 QLSCSI
A 000 001c01:
A 000 001c01: Ibrick Widget f PCI slot 4 pciid 000310a9 IOC3
A 000 001c01:
A 000 001c01: Running serial_dma diag (Bridge base = 0x920000000f000000 PCI dev = 4)
A 000 001c01: serial_dma: Data compare for uartA (c00000001fd6f400).....
A 000 001c01: serial_dma: Data compare for uartB (c00000001fd6fc00).....
A 000 001c01: RSLT serial_dma PASS
A 000 001c01:
A 000 001c01: Ibrick Widget f PCI slot 5 pciid ffffffffc8611045 USB
A 000 001c01: DONE
A 000 001c01: BTE0 completed.
A 000 001c01: BTE1 completed.
A 000 001c01: RSLT hub_bte_diag PASS
A 000 001c01: LLP Link never came out of reset!
A 000 001c01: Discovering NUMAlink connectivity .........
A 000 001c01:
A 000 001c01: Local hub NUMAlink is down.
A 000 001c01: *** Local network link down
A 000 001c01: DONE
A 000 001c01: Found 1 objects (1 hubs, 0 routers) in 8319 usec
A 000 001c01: Waiting for peers to complete discovery.... DONE
A 000 001c01: No other nodes present; becoming global master
A 000 001c01: Global master is /hw/rack/001/bay/01
A 000 001c01: \�\�\�\�Intializing any CPUless nodes.............. \�\�DONE
A 000 001c01: \�Checking partitioning information ......... DONE
A 000 001c01: No other nodes present; becoming partition master
A 000 001c01: \�Loading BASEIO prom ....................... DONE
BASEIO PROM Monitor SGI Version 6.210 built 02:30:38 PM Aug 26, 2004 (BE64)
1 CPUs on 1 nodes found.
Automatic update of PROM environment disabled
PS/2 Keyboard & Mouse diagnostics
IOC3 Base address = 920000000f800000
km_csr = 0000c990 @ 920000000f80009c
k_rd = 00000000 @ 920000000f8000a0
m_rd = 08000000 @ 920000000f8000a4
k_wd = 00000000 @ 920000000f8000a8
m_wd = 00000000 @ 920000000f8000ac
Testing IOC3 pckm Status/Config register
Reinitializing IOC3 km_csr = 0x00c0c110
Found mouse on port 0
Found keyboard on port 1
Keyboard passed self-test
Mouse passed self-test
RSLT pckm PASS
PS/2 Keyboard & Mouse diagnostics passed
Graphics diagnostics
Odyssey board #0 found on nasid 0
Running Odyssey xtalk sanity diag...
Actual board's registers state:
XT_REQ_TIMEOUT = 0x000fffff
XT_INTR_DST_HI = 0x00000000
XT_INTR_DST_LO = 0x00000000
FLCTL_CONFIG = 0x0001c000
Board version 1 - Buzz revision 2B
On board sdram size: 32 Mb
Cas latency: CAS 3
2 banks by sdram module
Running Odyssey Buzz registers diag...
RSLT gfx PASS
Device passed diagnostics
Installing PROM Device drivers ............
Running enet_all diag (Bridge base = 0x920000000f000000 PCI dev = 4 Mode = 3)
Running enet_ssram diag (Bridge base = 0x920000000f000000 PCI dev = 4) ... passed (269308 us).
RSLT enet_ssram PASS
Running enet_tx_clk diag (Bridge base = 0x920000000f000000 PCI dev = 4) ... passed (9 us).
RSLT enet_tx_clk PASS
Running enet_phy_reg diag (Bridge base = 0x920000000f000000 PCI dev = 4) ... passed (47488 us).
RSLT enet_phy_reg PASS
Running enet_ioc3_loop diag (Bridge base = 0x920000000f000000 PCI dev = 4) ... passed (97136 us).
RSLT enet_ioc3_loop PASS
Running enet_phy_loop diag (Bridge base = 0x920000000f000000 PCI dev = 4) ... passed (697003 us).
RSLT enet_phy_loop PASS
Running enet_tw_loop diag (Bridge base = 0x920000000f000000 PCI dev = 4) ... passed (82751 us).
RSLT enet_tw_loop PASS
Running enet_xtalk_stress diag (Bridge base = 0x920000000f000000 PCI dev = 4) ... passed (5070474 us).
RSLT enet_xtalk_str PASS
enet_all: Enet diags all passed (7953318 us).
Base I/O Ethernet set to /dev/ethernet/ef0
Installing Graphics Console...
graphics install: searching for pipe 0
Running scsi_ram diag (Bridge base = 0x920000000f000000 PCI dev = 1)
scsi_ram: Running SCSI mailbox test.
scsi_ram: SCSI mailbox test passed ....
scsi_ram: Testing SCSI RAM
RSLT scsi_ram PASS
Running scsi_dma diag (Bridge base = 0x920000000f000000 PCI dev = 1)
RSLT scsi_dma PASS
Walking SCSI Adapter 0, (pci id 1)
1+ Device Vendor Product: QUANTUM ATLAS10K2-TY184L
2- 3- 4- 5- 6- 7- 8- 9- 10- 11- 12- 13- 14- 15- = 1 device(s)
Walking SCSI Adapter 1, (pci id 1)
1- 2- 3- 4- 5- 6+ Device Vendor Product: TOSHIBA DVD-ROM SD-M1711
7- 8- 9- 10- 11- 12- 13- 14- 15- = 1 device(s)
Initializing PROM Device drivers .......... DONE
Automatic update of PROM environment disabled
Installing PROM Device drivers ............
Base I/O Ethernet set to /dev/ethernet/ef0
Installing Graphics Console...
graphics install: searching for pipe 0
Walking SCSI Adapter 0, (pci id 1)
1+ Device Vendor Product: QUANTUM ATLAS10K2-TY184L
2- 3- 4- 5- 6- 7- 8- 9- 10- 11- 12- 13- 14- 15- = 1 device(s)
Walking SCSI Adapter 1, (pci id 1)
1- 2- 3- 4- 5- 6+ Device Vendor Product: TOSHIBA DVD-ROM SD-M1711
7- 8- 9- 10- 11- 12- 13- 14- 15- = 1 device(s)
Initializing PROM Device drivers .......... DONE
escaping to L1 system controller
001a01-L1>debug 0
debug switches set to 0x0000
returning to console mode 001a01 console, <CTRL_T> to escape to L1
ALL tests 100%, also I should note ALL diags for DIMMs were 100% passed as well (in both online, offline, and PROM testing). Also I still have no error_dump content in POD mode.
So, I didn't get to pandora testing...I'll have to pick apart the tester to bypass whatever did the crash?!?!
This is starting to really become demoralizing, I'm running out of ideas here. I have the latest software (excluding any 6.5.30 patches...I want to look into them but the CDROM I burnt has cut off names the software mamanger won't accept) so I'll need to get it online to do the patchsets (if any).
So I'd like to try stress testing with Pandora (not probing) and see what happens. Right now the board's built in diags say nothing but good things, the older SGI diags say bad things...system appears to run but without a stress test I'm unsure what to think.
Any advice?


 NEED ->

 )
)